1  First steps with Polars

First of all we need to install all the packages and create an big random dataset needed for this book to work, so don’t bother with the following code:

Code
# Set CRAN mirror (required for non-interactive environments)
options(repos = c(CRAN = "https://cloud.r-project.org"))

# Installation of packages for cookbook-rpolars
packages <- c('dplyr','data.table','tidyr','arrow','DBI','fakir','tictoc','duckdb','microbenchmark','readr','fs','ggplot2','pryr','dbplyr','forcats','collapse')
installed_packages <- packages %in% rownames(installed.packages())
if (any(installed_packages == FALSE)) {
  install.packages(packages[!installed_packages], dependencies = TRUE)
}

# Loading packages
invisible(lapply(packages, library, character.only = TRUE))

# Load tidypolars
library(tidypolars)

# Creation of iris_dt
iris_dt <- as.data.table(iris)

1.1 Installation

Until the R polars package is uploaded to CRAN, the polars package development team offers several solutions for installation.

The most practical one in my opinion at the moment is to use R-universe and install like this:

install.packages("polars", repos = "https://community.r-multiverse.org")

To know the version of the polars package you have just installed and to have information on which features are enabled, you can use the polars_info() function.

library(polars)

polars_info()
Polars R package version : 0.22.4
Rust Polars crate version: 0.45.1

Thread pool size: 4 

Features:                               
default                    TRUE
full_features              TRUE
disable_limit_max_threads  TRUE
nightly                    TRUE
sql                        TRUE
rpolars_debug_print       FALSE

Code completion: deactivated 

If you want to install also the tidypolars package, you can do:

install.packages("tidypolars", repos = c("https://community.r-multiverse.org", 'https://cloud.r-project.org'))

Click here to see the list of base R and tidyverse functions supported by {tidypolars}.

1.2 First glimpse

From the official documentation:

In polars, objects of class Series are analogous to R vectors. Objects of class DataFrame are analogous to R data frames. Notice that to avoid collision with classes provided by other packages, the class name of all objects created by polars starts with “RPolars”. For example, a polars DataFrame has the class “RPolarsDataFrame”.

To create Polars Series and DataFrames objects, we load the library and use constructor functions with the pl$ prefix. This prefix is very important, as most of the polars functions are made available via pl$:

1.2.1 Convert an existing R data.frame to a polars DataFrame

First example to convert the most famous R data frame (iris) to a Polars DataFrame.

To convert existing R data.frame to polars DataFrame, you can use as_polars_df() function :

library(polars)
iris_polars <- as_polars_df(iris)
iris_polars
shape: (150, 5)
┌──────────────┬─────────────┬──────────────┬─────────────┬───────────┐
│ Sepal.Length ┆ Sepal.Width ┆ Petal.Length ┆ Petal.Width ┆ Species   │
│ ---          ┆ ---         ┆ ---          ┆ ---         ┆ ---       │
│ f64          ┆ f64         ┆ f64          ┆ f64         ┆ cat       │
╞══════════════╪═════════════╪══════════════╪═════════════╪═══════════╡
│ 5.1          ┆ 3.5         ┆ 1.4          ┆ 0.2         ┆ setosa    │
│ 4.9          ┆ 3.0         ┆ 1.4          ┆ 0.2         ┆ setosa    │
│ 4.7          ┆ 3.2         ┆ 1.3          ┆ 0.2         ┆ setosa    │
│ 4.6          ┆ 3.1         ┆ 1.5          ┆ 0.2         ┆ setosa    │
│ 5.0          ┆ 3.6         ┆ 1.4          ┆ 0.2         ┆ setosa    │
│ …            ┆ …           ┆ …            ┆ …           ┆ …         │
│ 6.7          ┆ 3.0         ┆ 5.2          ┆ 2.3         ┆ virginica │
│ 6.3          ┆ 2.5         ┆ 5.0          ┆ 1.9         ┆ virginica │
│ 6.5          ┆ 3.0         ┆ 5.2          ┆ 2.0         ┆ virginica │
│ 6.2          ┆ 3.4         ┆ 5.4          ┆ 2.3         ┆ virginica │
│ 5.9          ┆ 3.0         ┆ 5.1          ┆ 1.8         ┆ virginica │
└──────────────┴─────────────┴──────────────┴─────────────┴───────────┘

1.2.2 Count the number of lines

For example, to count the number of lines of the iris data frame :

# With pl$ prefix
as_polars_df(iris)$height
[1] 150
# Using iris_polars
iris_polars$height
[1] 150
nrow(iris)
[1] 150

1.2.3 Extract data from a DataFrame

To select the first 5 iris rows and the Petal.Length and Species columns, syntax is identical between Polars and R base:

iris_polars[1:5, c("Petal.Length", "Species")]
shape: (5, 2)
┌──────────────┬─────────┐
│ Petal.Length ┆ Species │
│ ---          ┆ ---     │
│ f64          ┆ cat     │
╞══════════════╪═════════╡
│ 1.4          ┆ setosa  │
│ 1.3          ┆ setosa  │
│ 1.5          ┆ setosa  │
│ 1.4          ┆ setosa  │
└──────────────┴─────────┘
iris_polars |>
  slice_head(n = 5)
shape: (5, 5)
┌──────────────┬─────────────┬──────────────┬─────────────┬─────────┐
│ Sepal.Length ┆ Sepal.Width ┆ Petal.Length ┆ Petal.Width ┆ Species │
│ ---          ┆ ---         ┆ ---          ┆ ---         ┆ ---     │
│ f64          ┆ f64         ┆ f64          ┆ f64         ┆ cat     │
╞══════════════╪═════════════╪══════════════╪═════════════╪═════════╡
│ 5.1          ┆ 3.5         ┆ 1.4          ┆ 0.2         ┆ setosa  │
│ 4.9          ┆ 3.0         ┆ 1.4          ┆ 0.2         ┆ setosa  │
│ 4.7          ┆ 3.2         ┆ 1.3          ┆ 0.2         ┆ setosa  │
│ 4.6          ┆ 3.1         ┆ 1.5          ┆ 0.2         ┆ setosa  │
│ 5.0          ┆ 3.6         ┆ 1.4          ┆ 0.2         ┆ setosa  │
└──────────────┴─────────────┴──────────────┴─────────────┴─────────┘
iris[1:5, c("Petal.Length", "Species")]
  Petal.Length Species
1          1.4  setosa
2          1.4  setosa
3          1.3  setosa
4          1.5  setosa
5          1.4  setosa
iris |> 
  dplyr::slice_head(n = 5) |> 
  dplyr::select(Petal.Length,Species)
  Petal.Length Species
1          1.4  setosa
2          1.4  setosa
3          1.3  setosa
4          1.5  setosa
5          1.4  setosa
iris_dt[1:5, .(Petal.Length, Species)]
   Petal.Length Species
          <num>  <fctr>
1:          1.4  setosa
2:          1.4  setosa
3:          1.3  setosa
4:          1.5  setosa
5:          1.4  setosa

1.3 Data Structures

The core base data structures provided by Polars are Series and DataFrames.

1.3.1 Series and vectors

Important

Series are a 1-dimensional data structure. Within a series all elements have the same Data Type.

In Polars objects, Series object are like R vectors.
To create a Polars Series from scratch, you can use as_polars_series() function :

mynumbers_serie <- as_polars_series(1:3)
mynumbers_serie
polars Series: shape: (3,)
Series: '' [i32]
[
    1
    2
    3
]
myletters_serie <- as_polars_series(c("a","b","c"))
myletters_serie
polars Series: shape: (3,)
Series: '' [str]
[
    "a"
    "b"
    "c"
]
# To name a Series
as_polars_series(name = "myletters", c("a","b","c"))
polars Series: shape: (3,)
Series: 'myletters' [str]
[
    "a"
    "b"
    "c"
]
mynumbers_vector <- 1:3
mynumbers_vector
[1] 1 2 3
myletters_vector <- c("a","b","c")
myletters_vector
[1] "a" "b" "c"

1.3.2 DataFrame and data.frame

Note

A DataFrame is a 2-dimensional data structure that is backed by a Series, and it can be seen as an abstraction of a collection (e.g. list) of Series.

In polars objects, DataFrame object are like R data.frame and close to a tibble and a data.table object. DataFrame has some attributes and you can see here to know how you can use it.

To create a Polars DataFrame from scratch:

# Creation of a DataFrame object with Series
mydf <- pl$DataFrame(
  col1 = mynumbers_serie,
  col2 = myletters_serie
)
# Creation of a DataFrame object with Series and vectors
pl$DataFrame(
  col1 = mynumbers_serie,
  col2 = myletters_vector
)
shape: (3, 2)
┌──────┬──────┐
│ col1 ┆ col2 │
│ ---  ┆ ---  │
│ i32  ┆ str  │
╞══════╪══════╡
│ 1    ┆ a    │
│ 2    ┆ b    │
│ 3    ┆ c    │
└──────┴──────┘
data.frame(
  col1 = mynumbers_vector,
  col2 = myletters_vector
)
  col1 col2
1    1    a
2    2    b
3    3    c
tibble(
  col1 = mynumbers_vector,
  col2 = myletters_vector
)
# A tibble: 3 × 2
   col1 col2 
  <int> <chr>
1     1 a    
2     2 b    
3     3 c    
data.table(
  col1 = mynumbers_vector,
  col2 = myletters_vector
)
    col1   col2
   <int> <char>
1:     1      a
2:     2      b
3:     3      c

1.3.2.1 Missing values

As in arrow, missing data is represented in Polars with a null value. This null missing value applies for all data types including numerical values.

You can manually define a missing value using NA value in R:

pl$DataFrame(
  col1 = as_polars_series(c(NA,"b","c"))
)
shape: (3, 1)
┌──────┐
│ col1 │
│ ---  │
│ str  │
╞══════╡
│ null │
│ b    │
│ c    │
└──────┘

To learn more about dealing with missing values in polars, see here.

1.4 Manipulation of Series and DataFrames with R standard functions

Series and DataFrames can be manipulated with a lot of standard R functions.
Some examples with Series:

sum(mynumbers_serie)
[1] 6
paste(myletters_serie,collapse = "")
[1] "abc"

Some examples with DataFrames:

names(mydf)
[1] "col1" "col2"
ncol(mydf)
[1] 2

1.5 Expressions

Here I’m quoting what Damian Skrzypiec said in his blog about Polars expressions:

One of fundamental building blocks in Polars are Polars expressions. In general Polars expression is any function that transforms Polars series into another Polars series. There are few advantageous aspects of Polars expressions. Firstly expressions are optimized. Particularly if expression need to be executed on multiple columns, then it will be parallelized. It’s one of reasons behind Polars high performance. Another aspect is the fact the Polars implements an extensive set of builtin expressions that user can compose (chain) into more complex expressions.

This is what an Polars expression looks like:

pl$col("Petal.Length")$round(decimals = 0)$alias("Petal.Length.rounded")

Which means that: - Select column “Petal.Length” - Then round the column with 0 decimals - Then rename the column “Petal.Length.rounded”

Tip

Every expression produces a new expression, and that they can be piped together.

For example:

pl$col("bar")$filter(pl$col("foo") == 1)$sum()

If you have read this far and managed to reproduce the examples, congratulations! You are ready to dive into the deep end of Polars with R in the next parts of this cookbook! 🚀

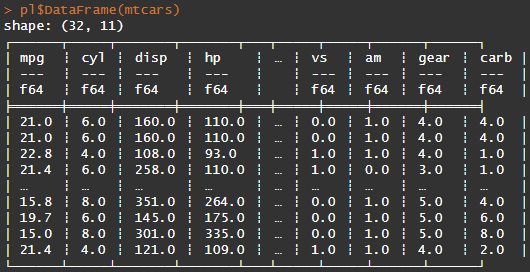
1.6 DataFrames display on Windows

This section is for Windows and RStudio users only!

As a Windows and RStudio user, you may encounter a problem with the display of Polars DataFrames.

Here’s what can happen with the default font in RStudio Lucida Console:

Displaying the mtcars DataFrame with Lucida Console font.

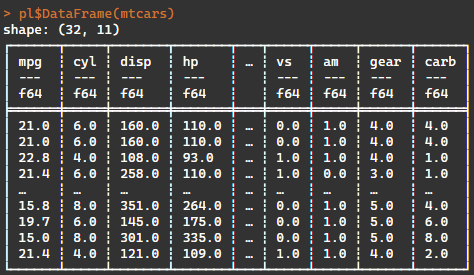
To resolve this display problem, I recommend using the Cascadia font:

Displaying the mtcars DataFrame with Cascadia font.